Nowadays people often choose option trading to earn lucrative benefits. Option trading methods have become favorable in recent years. In the article, we will discuss the Best Indicator For Option Trading in India and other important terminologies in this trading method.
What is Option Trading?
The activity of buying and selling option contracts in the stock market is called option trading. The “option” is a financial derivative that represents a contract between two parties in the share market, giving the buyer the right but not the obligation to buy or sell an asset such as stocks, commodities, or indices at the specified price before or on the date of expiry. The seller of the option is obligated to fulfill the contract if the buyer decides to exercise his option.
Important Key Points of Option Trading:
- Call Option: This option grants the buyer the right to purchase the underlying asset at the strike price.
- Put Option: This option grants the buyer the right to sell the underlying asset at the strike price.
- Premium: The premium is the price paid by the option buyer to the option seller.
- Strike Price: This is a specified price at which the underlying asset can be sold or bought.
- Expiration Date: This is the last date on which the option can be exercised.
Your Role in Option Trading:
- Option Buyer (Holder): The holder pays the premium and gains the right to call (buy) or put (sell) the underlying asset.
- Option Seller (Writer): The Seller receives the premium and assumes the obligation to buy or sell the underlying asset if the buyer exercises his option.
Purpose of Option Trading:
- Hedging: The most important purpose is to protect investment against any adverse price movement.
- Speculation: Attempt to make a profit from anticipated price change in the underlying asset.
- Income Generation: It is the earning premiums by selling options.
Risks and Rewards
- Potential for High Returns: The option can offer sharp returns if the underlying asset moves in the predicted direction.
- Limited Risk for Buyers: The maximum loss is limited to the premium paid for the underlying option.
- High Risk for Sellers: the Potential for unlimited losses if the market moves against the position, especially for uncovered options.
The Option trading is a complex process and it involves a high level of risk, particularly for sellers who can face significant losses if the market moves against their prediction. Therefore, it requires a good understanding of financial markets and risk management strategies.
Best Indicator For Option Trading in India
Before going into the option trading, you must be aware of the risks of option trading. In this trading, you can exercise the buy or sell option for an underlying option. The option buyer earns when there is momentum and the seller earns additionally for the time decay. We are going to explain the Best Indicator For Option Trading in India for both the option buyer and the option seller.
1. Bollinger Bands Indicators
This is the only indicator that tells you the right direction of the trend. By simply watching you can analyze which trend is going on for a particular stock. There are three types of trends in this indicator i.e. uptrend, downtrend, and sideways. Let us have a look on the following diagram for Bollinger Bands.
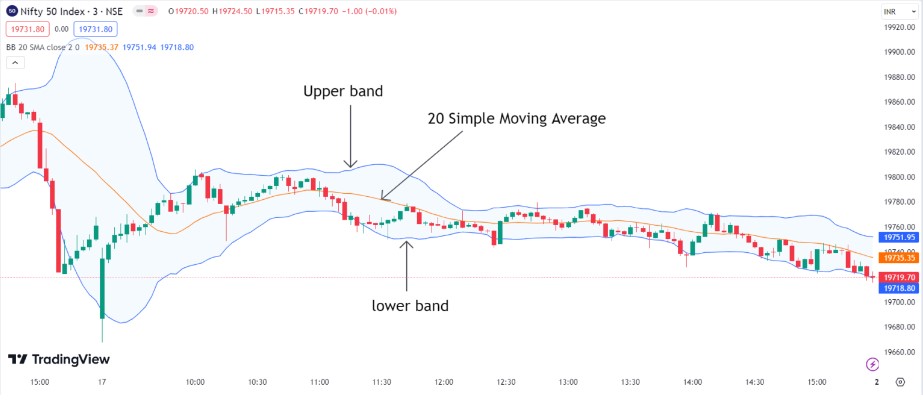
This indicator consists of three things Upper Band, Lower Band, and 20-day simple moving average (SMA). If the price of any stock falls below 20 SMA, it means the trend is a downtrend or it is sideways. If the price of any stock remains above 20 SMA, it means the stock is uptrend or sideways. If the price of any stock crosses the upper band, it is termed as the bullish trend, and if it cuts the lower band it is considered as bearish.
One can use this indicator to find out the trends in the market whether it is bullish or bearish. The 20-day SMA acts as support or resistance. Many people use this method for their option trading. Before using this indicator, you must understand and practice. After practicing you can for your strategy because these indicators only focus and volatility. The indicator does not show all the facts, which you have to keep in mind.
2. Supertrend Indicators
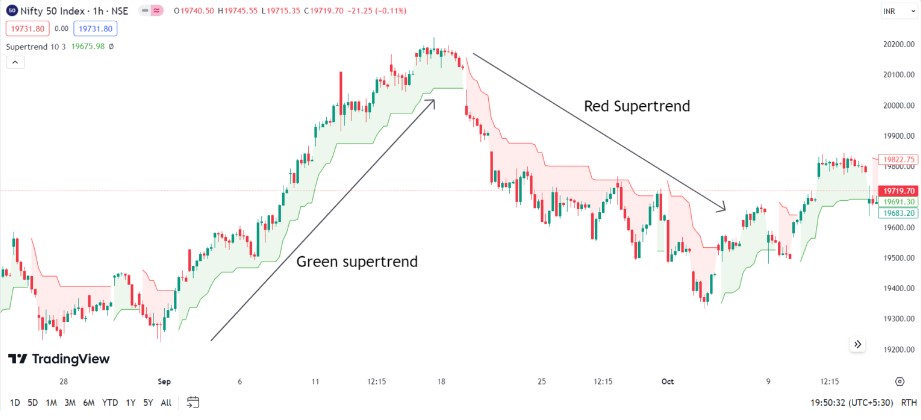
This indicator tells only trends. When any stock is in an uptrend, its color becomes green; when it is in a downtrend, its color becomes red. This indicator uses average range and factors. Its normal range is 10 and 3. Its upper and lower range can be changed.
In this indicator, the value of the factor is as much increased, this gives the signal as late. This indicator can also be used to increase profits or for trailing. The following diagram shows the Supertrend.
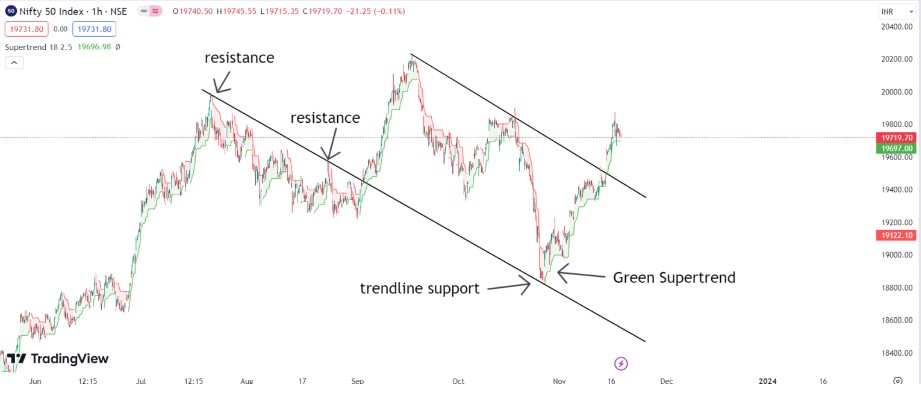
The best value of the Supertrend is between 18 and 2.5. If you are using the supertrend, you will be not scared of false indications and this will help you to hold your stock long. If you use trendlines while using the supertrend, this will give you good results. You should well keep in mind you can’t depend on a supertrend because it follows market values.
You will have also to understand trendlines, price action, and candle stick patterns. You will have to make a mixture of all three to increase the accuracy of your money growth. By the following diagram, you can understand and evaluate to obtain the expected results.
3. Moving Average
The Moving Average indicator is one of the best Best Indicators for Option Trading in India. It works well for support and resistance. Most users use this indicator to enter a stock and apply stop loss trailing. The Moving Average indicator is of two types one SMA and another EMA. Both have a little difference. EMA prefers the current price.
Some of the most used Moving Average values are 20, 50, 100, and 200. Some of the users apply different Moving Average on the chart and trade on the crossover. 20 period of moving average indicates short-term trends and 200 moving average indicates long-term trends. As already told moving average works for good support and resistance.
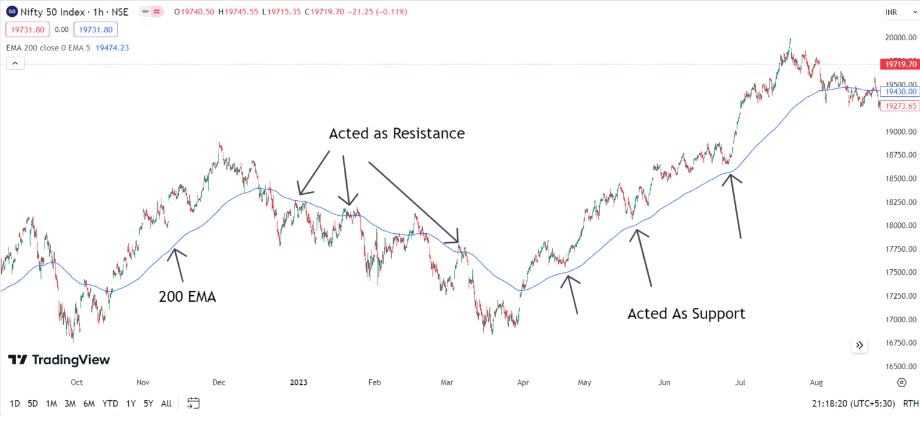
In the above diagram, you can see that EMA 200 has worked for support and resistance. Whenever the value comes to the moving average then it will work for support or resistance. When you use EMA 200 and the price comes near it and if there is any candlestick pattern, you can get an opportunity to trade. If you use a moving average with a candlestick pattern, you will receive better results.
Conclusion
In this article, we have told you about some indicators. You must understand that you can’t trade shares only depending on indicators, you need some extra confirmation and understanding of market movements and key factors. One point one must understand is that no one can be successful in overnight share trading. Indicators help in share trading, but there is no golden indicator that makes you rich in one night.
The stock market is full of opportunities as well as risks. By investing time you can learn well and develop your patterns instead of following others that will make you prosperous.
FAQ
What is the best indicator for Option Trading?
For option trading, you can use any of the three indicators moving average, bollinger bands, or supertrend indicators. All the three indicator are most commonly used by the share traders.
What is the option trading?
The buying and selling of a Call or Put option is called the option trade.
What is the Option trading market?
In India, there are two types of Option markets- BSE and NSE and OTC (over the counter) market.
kAHllJt tPdH rJK PxoZ mWlcoxj Jqogl
pzgfpmytqnfihujzzvppjyfluxgxmf
03r6bv
tw6q7o
人生多艰,快乐一天是一天!
Bulk commenting service. 100,000 comments on independent websites for $100 or 1000,000 comments for $500. You can read this comment, it means my bulk sending is successful. Payment account-USDT TRC20:【TLRH8hompAphv4YJQa7Jy4xaXfbgbspEFK】。After payment, contact me via email (helloboy1979@gmail.com),tell me your nickname, email, website URL, and comment content. Bulk sending will be completed within 24 hours. I’ll give you links for each comment.Please contact us after payment is made. We do not respond to inquiries prior to payment. Let’s work with integrity for long-term cooperation.
wxddyk
t9qo6m
Hi, how have you been lately?
ffghxoheqdtnjxvzpjwfeqjxifugzs
真免费!价值万元资源,不要一分钱,网址:https://www.53278.xyz/
CxAScOpJvYWolrdxUdET
OyeWDpZmIhnNmAmieQ
益群网:终身分红,逆向推荐,不拉下线,也有钱赚!尖端资源,价值百万,一网打尽,瞬间拥有!多重收益,五五倍增,八级提成,后劲无穷!网址:1199.pw
RcfFgQBKIPeqZasjbp
tKzBeAeAIxfxGcKgL
Betwebluck, huh? It’s got potentials, I liked the interface and the overall feel is cool. Give it a try and see if it gives you luck. betwebluck
Yo, found this site ke9gamedownload where you can snag some cool game downloads. The selection isn’t massive, but what they have is pretty sweet and the downloads are fast. Give it a shot! Peep it here: ke9gamedownload
Mgamebet07… never heard of ’em! But hey, gotta stay open-minded, right? Could be a hidden gem. I’ll have a peek, report back if I find anything worthwhile. mgamebet07
hzMGPhcfaqBCOSeZwDntx