
The Indicator Trap — And Why Smart Traders Escape It
It’s a Tuesday morning. The screen is glowing, and you’ve done your homework.
You pull up the daily chart of a high-flying tech stock. The Relative Strength Index (RSI) is at 68—strong, but not yet overbought. The Moving Average Convergence Divergence (MACD) printed a bullish crossover two days ago. The stock has been climbing steadily for a week. The setup looks flawless. You buy an at-the-money call option, expecting the breakout to continue.
By Thursday afternoon, the stock is completely flat. It hasn’t dropped a single dollar. Yet, you look at your brokerage account and your call option is down 30%. Implied volatility quietly contracted, and time decay ate away your premium while you waited for a move that never came.
Frustrated, you close the trade for a loss. It’s your third red trade in a row. You open a new browser tab and type: “best indicator for options trading.”
Most traders know this feeling intimately. The market hands you a loss that makes zero sense based on your reading of the chart, and your immediate instinct is to blame the tool. So you search for a new one. You swap RSI for the Stochastic Oscillator. You tweak your moving average periods. You consider buying an expensive course that promises a proprietary “smart money” indicator with a 90% win rate.
Here is the hard truth: The indicator didn’t fail. Your framework did.
Markets are driven by human emotion and institutional order flow, not rigid mathematical formulas. No single best indicator can fully capture that complexity. Professionals aren’t using secret, superior indicators. Instead, they are asking a fundamentally different question. They don’t ask, “What does this indicator say?” They ask, “What evidence supports this trade?”
This shift—from indicator-hunting to evidence-building—is what separates consistently profitable traders from those who slowly bleed their accounts dry.
What Experienced Traders Learn the Hard Way
Experienced options traders eventually arrive at a few sobering realizations that beginners actively try to avoid:
- Indicators measure past data; they do not predict the future. An indicator is just a mathematical derivative of price and volume. It cannot foresee a sudden news catalyst or a massive institutional block trade.
- You don’t need to catch every move. Amateurs use indicators to try and trade every minor blip on the 5-minute chart. Professionals use indicators to filter out the noise and wait for the “fat pitch” where probability is heavily skewed in their favor.
- Complexity does not equal profitability. A chart cluttered with ten different indicators often leads to analysis paralysis. Simplicity, executed with ruthless discipline, is infinitely more profitable.
Why Options Traders Struggle More Than Stock Traders
A stock trader who is directionally right makes money. It is a linear, simple game.
An options trader who is directionally right can still lose money. That is the painful reality most beginners don’t fully appreciate until it happens to them repeatedly. Options pricing introduces unseen forces that work against your position, regardless of what your technical indicators show. Understanding these forces is not optional; it is the bedrock of every trading decision.
Time Decay (Theta)
Every option has an expiration date. With every passing day, the option loses a small fraction of its value—even if the underlying stock doesn’t move a single penny. This erosion is called theta decay, and it accelerates exponentially as expiration approaches. For an options buyer, the clock is always your enemy.
Implied Volatility (IV)
Options are priced based on implied volatility—the market’s expectation of how much the underlying stock will move in the future. When IV is elevated, option premiums are expensive. When IV is low, premiums are cheap. A stock trader asks, “Is this stock going up?” An options trader must ask, “Is the premium I’m paying justified by the size of the move I’m expecting?”
Volatility Crush
When a known, high-anxiety event is approaching—like an earnings announcement or a Federal Reserve rate decision—implied volatility skyrockets. The moment that event passes, the uncertainty vanishes, and implied volatility collapses instantly. If you bought an option right before the event, the subsequent drop in IV (the “crush”) will evaporate your option’s value, even if the stock moves exactly the way you predicted.
Expiration Risk
Unlike shares of a company, options expire worthless if they do not reach profitability by a highly specific date and time. A perfectly correct thesis will result in a 100% loss if your timing is off by a mere 48 hours.
Action Step: The Options Reality Check
- Stop treating options like leveraged stock.
- Before placing a trade, look up the stock’s next earnings date. Never buy short-dated options over an earnings event unless utilizing a volatility-trading strategy.
- Check the Implied Volatility Rank (IVR). If it is above 50%, consider defined-risk spreads instead of outright calls or puts.
The $10,000 Mistake Most Traders Make
Meet Marcus. He’s been paper trading for eight months and feels confident reading charts. He understands support and resistance, watches YouTube tutorials on MACD, and trusts the RSI.
One afternoon, Marcus is watching a mid-cap software stock. It has been on an absolute tear, climbing for 11 consecutive days. He notices the daily RSI has just crossed above 70. He remembers the cardinal rule he learned in a beginner’s guide: Above 70 means overbought. The stock has to pull back.
He buys $800 worth of put options expiring in two weeks.
The following week, the stock climbs another 4%. His puts are instantly down to $310. RSI is now at 78. “It’s even more overbought now,” Marcus reasons. “The reversal must be imminent.” He holds his position.
For the next three days, the stock stops going up, but it doesn’t go down either. It just moves sideways. Time decay goes to work. His puts drop to $120. Frustrated, he closes the position. Total loss: $680.
Marcus made a mistake that costs retail traders millions of dollars every single week. He used a single, isolated data point to draw a massive conclusion. He assumed a reversal was guaranteed, which required four completely separate things to be true simultaneously:
- The stock was actually exhausted (not just in a powerful momentum trend).
- Selling pressure would be strong enough to force a reversal.
- The reversal would happen fast enough to outpace his option’s time decay.
- Implied volatility would remain stable.
None of these were verified. He made a blind bet against a stock in peak momentum based on a single number.
Same Indicator, Different Market
The RSI didn’t lie to Marcus; he just used it out of context. Indicators behave entirely differently depending on the market regime.
- RSI 70 in a range-bound market: An excellent signal to sell or buy puts. The market is oscillating, and reversion to the mean is highly probable.
- RSI 70 in a strong trend: A powerful continuation signal. It proves that institutional buyers are aggressively accumulating the stock.
The Real-World Proof: Consider Nvidia’s (NVDA) massive AI-driven rally. During peak expansion, the daily RSI remained well above 70 for extended periods. Traders who automatically shorted every overbought reading—assuming a pullback was mathematically required—were repeatedly run over by trend continuation. Real market momentum does not care about an oscillator ceiling.
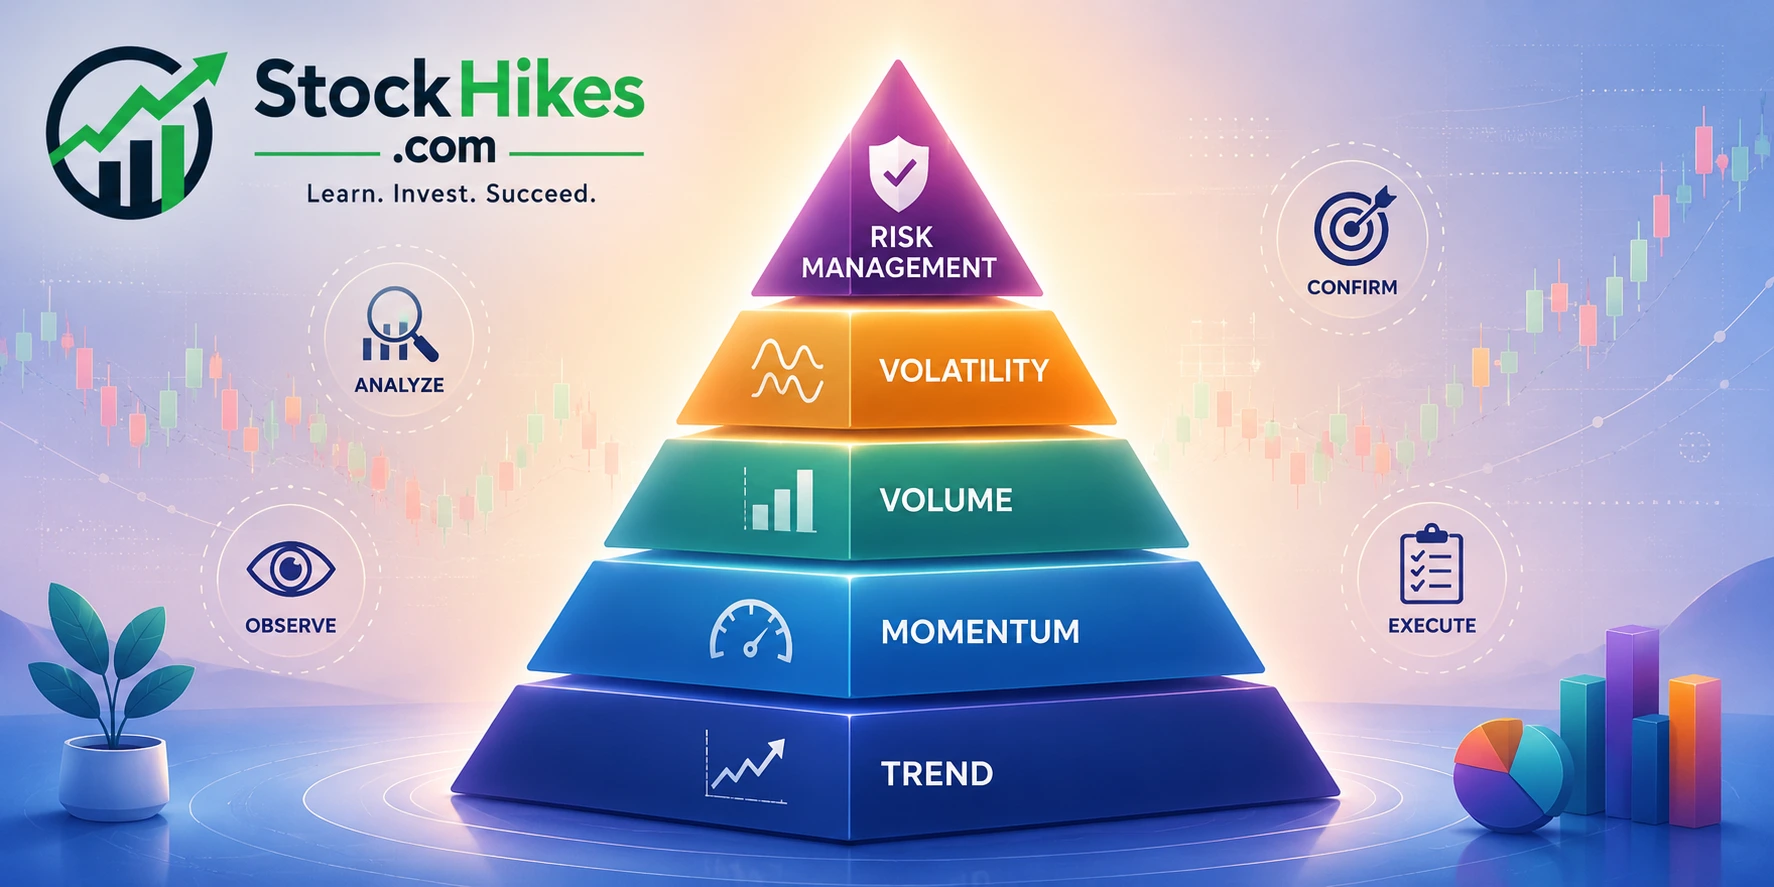
The Evidence Pyramid Framework
Instead of viewing technical indicators as strict “buy” or “sell” signals, you must view them as layers of evidence. You are a detective building a case. Every professional-grade trade is built from the bottom up.
If you miss a foundational layer, the structure is weak. If you miss two layers, you aren’t trading; you are gambling.
Level 1: Trend (The Anchor)
Trend is the highest-probability filter in existence. No matter how incredible a momentum signal looks on a 15-minute chart, if you are buying calls while the daily trend is crashing, the math is against you. Get Level 1 right, and you instantly eliminate 50% of your bad trades.
Level 2: Momentum (The Engine)
Trend tells you direction; momentum tells you if that trend has gas in the tank. A stock can drift sideways for weeks while technically sitting above its moving average. Momentum tools tell you if the trend is accelerating or dying.
Level 3: Volume (The Footprints)
Volume is the only indicator that cannot be faked by price action. It reveals actual institutional capital flow. A technical breakout on light volume is a trap. A breakout on 2x average volume is a high-conviction setup.
Level 4: Volatility (The Pricing Matrix)
This layer is exclusive to options. Before you buy premium, you must know if you are buying at a fair price or stepping into an inflated IV trap.
Level 5: Risk Management (The Shield)
Every edge is useless without capital preservation. The market will eventually throw a black swan at you. If you don’t have defined risk parameters, that event will wipe you out.
Graphic Asset Idea: The Options Trading Evidence Pyramid
Create a brandable infographic mapping the 5 levels (Trend → Momentum → Volume → Volatility → Risk Management) from bottom to top. To maximize engagement with USA-based audiences, format this as a vertical asset. Utilizing a modern, minimalist aesthetic with soft pastel colors, flat vector styles, and clean typography will help the graphic stand out against typically cluttered, overly aggressive finance visuals.
Best Indicators for Options Trading at a Glance
To build your pyramid efficiently, you must understand the exact job description of your tools.
| Indicator Category | Recommended Tools | Primary Job Description | When It Fails |
| Trend (Level 1) | 200-day SMA, 50-day EMA | Identifies the macro and intermediate path of least resistance. | Generates massive false signals in sideways, choppy markets. |
| Momentum (Level 2) | MACD, RSI | Confirms if a move has energy, or flags divergence before a reversal. | MACD lags heavily; RSI traps traders in strong parabolic trends. |
| Volume (Level 3) | Relative Volume, VWAP | Validates breakouts and proves institutional participation. | Useless in isolation without price context. |
| Volatility (Level 4) | IVR, TTM Squeeze, Bollinger Bands | Identifies options pricing anomalies and coiled energy pre-breakout. | Can stay compressed or elevated much longer than expected. |
The 3 Green Lights Rule
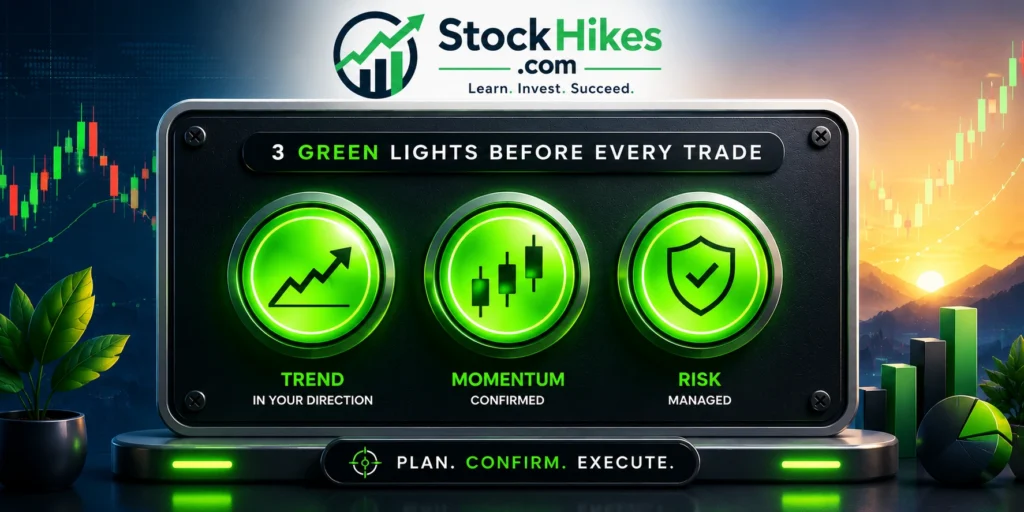
While the Evidence Pyramid is for deep analysis, the 3 Green Lights Rule is your real-time, rapid-fire filter. Think of it as the launch sequence on a dashboard. All three switches must flip to green before you have clearance to risk capital.
- Green Light 1 (Trend): Is the price trading in the direction of the dominant macro trend?
- Green Light 2 (Momentum): Does RSI and MACD confirm the trend is actively accelerating, with no bearish/bullish divergence?
- Green Light 3 (Volume): Is the current move backed by above-average volume or holding above the intraday VWAP?
| Green Lights | Signal Reading | Recommended Action |
| 3 of 3 | All systems aligned. | High-quality setup. Execute the trade plan. |
| 2 of 3 | One confirmation missing. | Wait. Let the setup fully develop or find a better asset. |
| 1 of 3 | Weak evidence. | Avoid. The odds are stacked against you. |
| 0 of 3 | Complete misalignment. | Stand aside. Cash is a valid position. |
The ultimate test of trader psychology is seeing “2 of 3” lights green, feeling the FOMO, and choosing to sit on your hands anyway.
Strengthening Your Trade Execution
Let’s look at how this framework prevents bad trades and identifies premium setups.
Example 1: The Bullish Call Setup (Why other setups are rejected)
The Scenario: It’s 10:30 AM. You are watching a large-cap semiconductor stock.
The Rejections: Earlier in the week, you saw a MACD crossover on a 15-minute chart. However, the daily chart showed the stock trading below its 50-day EMA (Trend failure), and the volume was 30% below average (Volume failure). You correctly rejected the trade.
The Current Setup:
- Trend: The stock just gapped up and is now trading firmly above its 50-day and 200-day SMA. Intraday, it is holding cleanly above VWAP. (Green Light)
- Momentum: The 15-minute MACD has crossed bullish, and the histogram is expanding. RSI is at 62 and rising. (Green Light)
- Volume: The breakout candle has 1.8x the average volume. Institutions are buying. (Green Light)
- Volatility Context: IV Rank is at 28%—relatively cheap. The options are not overpriced.
The Action: Because all lights are green, you buy an At-The-Money (ATM) call option. Crucially, you select an expiration 30 days out to minimize daily theta decay, giving the stock ample time to execute its move.
Example 2: The Bearish Put Setup (Patience pays)
The Scenario: A major retail sector ETF has rallied for three weeks and is now hitting a massive structural resistance level at $150.
The Thought Process:
Amateurs buy puts with the second price tag of $150, anticipating the rejection. Professionals wait for the ETF to prove it is failing.
- Trend: The ETF is at resistance, but the short-term trend is still technically up. You wait.
- Momentum (The Trigger): The ETF pushes to $150.50 (a marginal new high), but the RSI makes a significantly lower high. This is classic bearish divergence. Buyers are exhausted.
- Volume: The final push above $150 happened on anemic, declining volume.
- Risk Entry: You wait for the daily candle to close back below the 20-day EMA. The moment it breaks the market structure, your thesis is confirmed.
The Action: IV Rank is sitting at 65% (elevated). Instead of buying an expensive outright Put, you buy a Put Debit Spread to negate the volatility crush risk, targeting a 1:3 Risk-to-Reward payout.
Expanded Options-Specific Guidance
Selecting Expiration Dates
The most brutal mistake is buying options that expire too soon. If your chart indicates a swing trade that usually takes 5-7 days to play out, a weekly option is a death trap.
- Day Trades: 0-7 Days to Expiration (DTE). Highly aggressive, massive theta risk.
- Standard Swing Trades: 21-45 DTE. This is the sweet spot. It provides enough time for the technical setup to unfold while keeping the theta decay curve relatively flat.
Being Directionally Right Isn’t Enough
If you buy a Call, the stock must move up fast enough to outpace the theta burning off your contract every night. If the stock grinds upward at a snail’s pace, your option will lose money. You need a catalyst. This is why trading breakouts on high volume is mandatory for options buyers—volume creates the speed necessary to beat time decay.
The 30-Second Pre-Trade Checklist
Do not execute a trade until you can definitively answer “Yes” to these questions:
- [ ] Trend: Is the trade direction aligned with the macro trend (200 SMA)?
- [ ] Momentum: Does RSI/MACD confirm the trend without divergence?
- [ ] Volume: Is the current volume significantly higher than average?
- [ ] Pricing: Is the IV Rank below 50% (or am I using a spread to combat high IV)?
- [ ] Event Risk: Have I confirmed there are no earnings reports before my expiration?
- [ ] Time: Do I have at least 21 days to expiration for a swing trade?
- [ ] Risk: Do I know exactly what price invalidates my chart, and is my risk capped at 1-2% of my account?
Frequently Asked Questions
Q: What is the best indicator for options trading?
A: There isn’t one. Options trading requires assessing trend, momentum, volume, and implied volatility simultaneously. The most effective approach combines moving averages (trend), MACD/RSI (momentum), volume analysis, and IV Rank (volatility) into a unified framework.
Q: Why do I lose money on options even when the stock moves in the right direction?
A: This usually occurs because of time decay (theta) or a sudden drop in implied volatility (IV crush). If the stock moves in your direction, but it takes too long, the daily loss of time value outweighs the directional gain. Similarly, if you buy an option when IV is high, the premium will collapse once IV normalizes, causing a loss despite a correct directional guess.
Q: Is RSI enough for options trading?
A: Absolutely not. RSI only measures the velocity of recent price moves. It cannot tell you the macro trend, the volume profile, or whether the option premium is wildly overpriced.
Q: Should I use RSI or MACD?
A: Both, as they serve different purposes. RSI is excellent for spotting overbought/oversold extremes and momentum divergence. MACD is superior for identifying trend direction and confirming broader shifts in momentum.
Q: Can one indicator predict market direction?
A: No. Indicators lag. They reflect past data to help you calculate current probabilities. Trading is about risk management and probability stacking, not crystal-ball prediction.
Related Topics Worth Exploring
If you’re still unclear on why option premiums expand and contract, read our detailed guide on Implied Volatility Explained.
To better understand how time and price movements directly impact your contract’s value, check out Options Greeks for Beginners.
If you want to protect your capital from inevitable losing streaks, our breakdown on Risk Management for Traders is essential reading.
For those pivoting to income generation, compare two of the most popular strategies in Covered Calls vs. Cash-Secured Puts.
Finally, if you are trading equities rather than derivatives, adjust your toolkit with our Swing Trading Indicators setup guide.
Stop Hunting for the Perfect Indicator
There is a version of this article that ends by handing you a “secret formula”—a specific combination of moving averages and oscillators guaranteed to print money. That article would be incredibly satisfying to read. It would also be a complete lie.
Every indicator mentioned in this guide will eventually hand you a losing trade. RSI will stay “overbought” for a month while a stock rockets 40% higher. MACD will print a flawless bullish cross an hour before a geopolitical news event sends the market crashing. These are not edge cases; they are the daily realities of trading.
What doesn’t fail you is your process.
The Evidence Pyramid, the 3 Green Lights Rule, and the Pre-Trade Checklist are not magic wands. They are structural guardrails. They force you to build a logical, evidence-based case before you risk your hard-earned capital. They won’t eliminate losing trades—nothing will—but they will mercilessly eliminate stupid trades.
Stop looking for a better indicator. Start building a better decision-making process. The traders who survive long-term are not the ones who predict the market perfectly. They are the ones who manage risk ruthlessly, honor their framework, and never mistake a line on a chart for a guarantee.
Your edge isn’t on the chart. Your edge is your discipline.
Not every investor wants the fast-paced decision-making that comes with options trading. If your goal is long-term portfolio protection rather than active trading, consider learning how precious metals fit into a retirement strategy in our guide to Gold IRAs.
Disclaimer: This article is for educational and informational purposes only and does not constitute investment or financial advice. Options trading involves substantial risk and is not suitable for all investors. Past performance of any trading framework or strategy does not guarantee future results. Always consult a licensed financial professional before making investment decisions.